Note: This topic describes financial statements for Report Designer. If you want to produce financial statements for Excel Reporting, see How to design layouts for financial data reports (Excel Reporting).
This example show you how to create a layout which produces a report with the basic elements below:
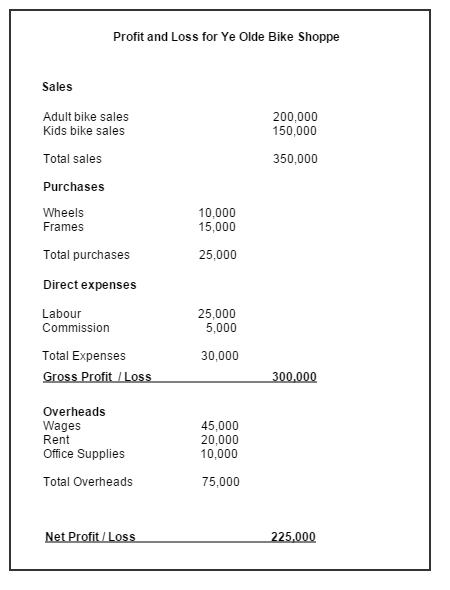
Create a new layout
Open: Settings > Cash Book / Nominal Ledger > Financial Statement Layouts.
- Choose New.
- Enter a name for the profit and loss report.
- Click Edit.
Add your sales
This is total income you've received from selling goods or services to your customers.
- Create a text line for your first section.
- Choose Text from the Type drop-down list.
- Enter the heading text in the Title column, e.g. Sales.
- Choose a heading style: 1 - 9.
- Enter a blank line.
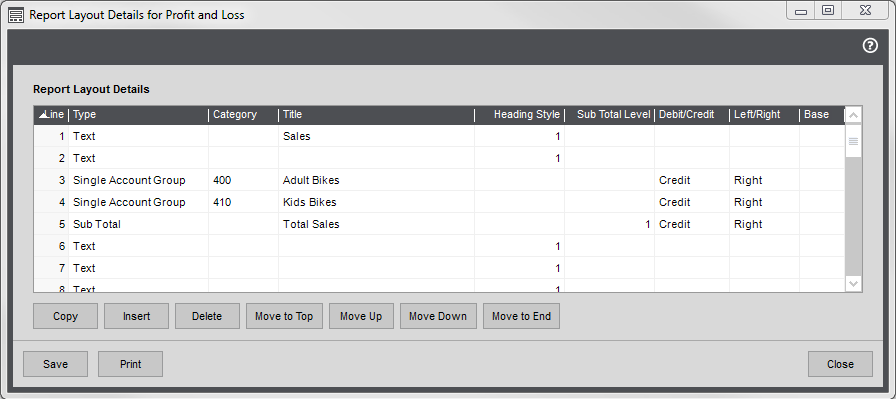
- Choose the report categories to include in your first section. This would usually be for your sales so add your Income report categories.
- Choose Single Account Group from the Type drop-down list.
- Choose the report category code from the drop-down list; e.g. 400 for Adult bikes sales.
- Change the Title if required.
- Choose Credit from the Debit/Credit drop-down list.
- Choose Right from the Left/Right drop-down list.
-
Repeat for all Income (Sales) report categories.
This company has two types of sales so only Adult Bikes and Kids Bikes report categories are required.
Tip: Make sure you've included all your sales accounts otherwise you might miss out on some profit!
- Create a total for the section.
- Choose Subtotal from the Type drop-down list.
- Enter some text in the Title column, such Total Sales. The text is bold by default.
Choose 1 in the subtotal level, as this adds up all rows above not included a subtotal. This totals up your sales.
- Choose Right from the Left/Right drop-down list.
- If you want to separate your sales in to sections, repeat for further report categories and subtotal rows. Use 1 as the subtotal level.
- Add blank text lines or dashes to break up the report.
Add your purchases
This is the total cost of materials you've purchased to re-sell or manufacture into goods to sell.
- Create a text line for the section.
- Choose Text from the Type drop-down list.
- Enter the heading text in the Title column, e.g. Purchases.
- Choose a heading style: 1 - 9.
- Enter a blank line.
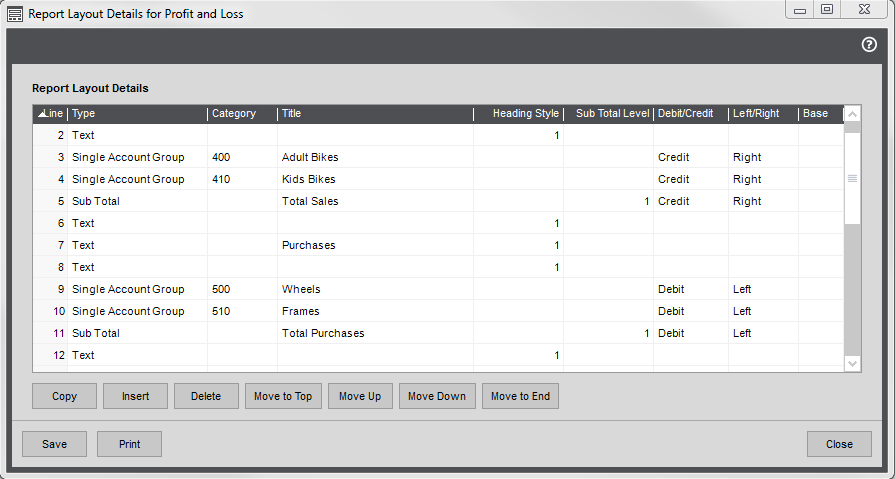
- Enter the report categories to include in this section. This is for your purchases so add Expense report categories.
- Choose Single Account Group from the Type drop-down list.
- Choose the report category code from the drop-down list; e.g. 500 for Wheel purchases.
- Change the Title if required.
- Choose Debit from the Debit/Credit drop-down list.
- Choose Left from the Left/Right drop-down list.
-
Repeat for all purchase report categories.
This company has two types of purchases so only one additional row for the Frames report category is required.
- Create a total for the section.
- Choose Subtotal from the Type drop-down list.
- Enter some text in the Title column, such Total Purchases. The text is bold by default.
Choose 1 in the subtotal level, as this add up all rows above not included in a sub total.
As your sales are already included in a subtotal above, this totals your purchases only.
- Choose Debit from the Debit/Credit drop-down list.
- Choose Left from the Left/Right drop-down list. This prints the total to the left of the column to distinguish it from the value of the individual rows.
Add your direct expenses
This is additional costs you've incurred to allow you to sell goods to your customers such as the cost of labour to manufacture items or commission you pay to your sales staff.
- Create a text line for the section.
- Choose Text from the Type drop-down list.
- Enter the heading text in the Title column, e.g. Direct expenses.
- Choose a heading style: 1 - 9.
- Enter a blank line.
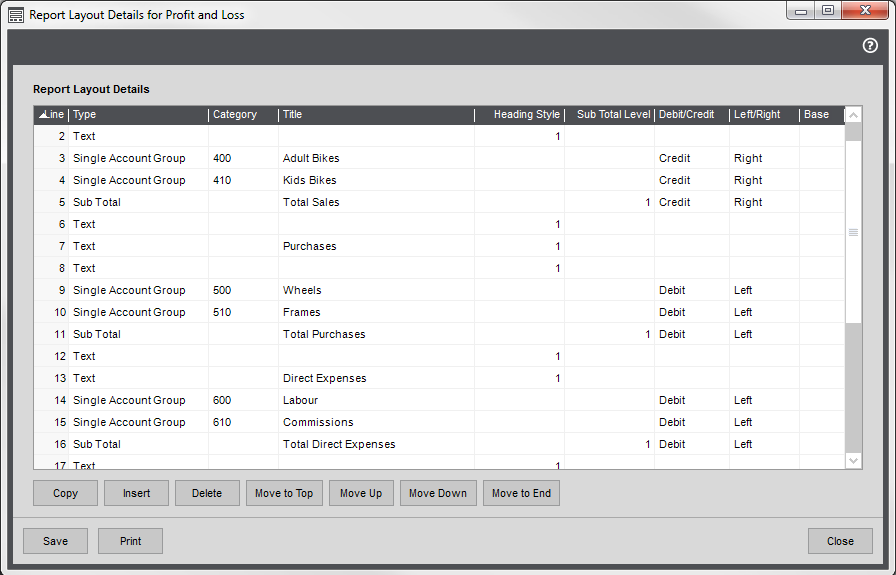
- Enter the report categories to include in this section. Add the relevant Expense report categories.
- Choose Single Report Group from the Type drop-down list.
- Choose the report category code from the drop-down list; e.g. 600 for Labour.
- Change the Title if required.
- Choose Debit from the Debit/Credit drop-down list.
- Choose Left from the Left/Right drop-down list.
-
Repeat for all direct expense report categories.
This company has two types of direct expense so only one additional row for the Commission report category is required.
- Create a total for the section.
- Choose Subtotal from the Type drop-down list.
- Enter some text in the Title column, such Total Direct Expenses. The text is bold by default.
Choose 1 in the subtotal level. as this adds up all rows above not included in a sub total.
As your sales and purchases are already included in subtotals above, this totals your direct expenses only.
- Choose Debit from the Debit/Credit drop-down list.
- Choose Left from the Left/Right drop-down list. This prints the total to the left of the column to distinguish it from the value of the individual rows.
Calculate the gross profit
This is calculated from your sales less your purchases and direct expenses.
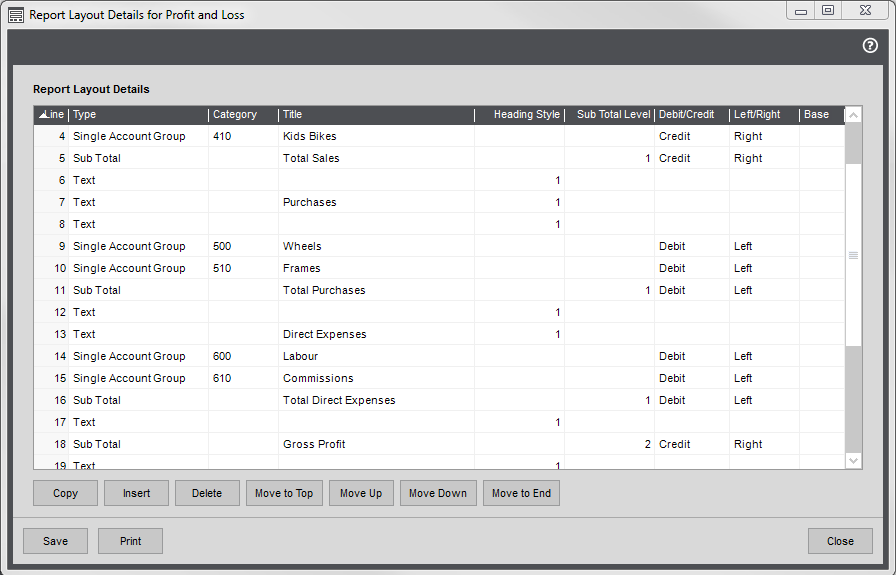
- Choose Subtotal from the Type drop-down list.
- Enter some text in the Title column, such as Gross Profit.
-
Choose 2 for the subtotal level. This adds all rows above not included in a level 2 subtotal.
As this is the first subtotal level 2, all your sales, purchases and direct expenses rows are added together. As sales are a credit value and expenses a debit value, the expenses are effectively subtracted from the sales.
- Choose Credit from the Debit/Credit drop-down list.
-
Choose Right from the Left/Right drop-down list. This prints the total to the right of the column to show it's a credit.
If this company wasn't making a profit, this value would be displayed in brackets.
Add your overheads
This is the total of all your other costs for running your business such as gas and electricity, staff wages, rent and so forth.
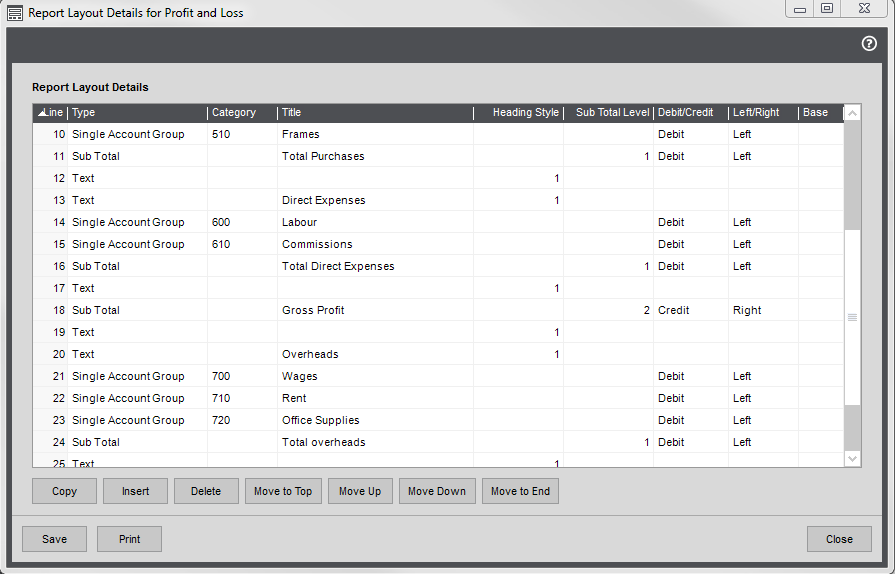
- Create a text line for the section.
- Choose Text from the Type drop-down list.
- Enter the heading text in the Title column, e.g. Overheads.
- Choose a heading style: 1 - 9.
- Enter a blank line.
- Enter the report categories to include in this section. Add the remaining Expense report categories.
- Choose Single Account Group from the Type drop-down list.
- Choose the report category code from the drop-down list; e.g. 700 for Wages.
- Change the Title if required.
- Choose Debit from the Debit/Credit drop-down list.
- Choose Right from the Left/Right drop-down list.
-
Repeat for all overhead report categories.
This company has three types of purchases so additional rows are required for the Rent and Office Supplies report categories.
- Create a total for the section.
- Choose Subtotal from the Type drop-down list.
- Enter some text in the Title column, such Total Overheads. The text is bold by default.
Choose 1 in the subtotal level, as this adds up all rows above not included in another subtotal.
As your sales, purchases and direct expenses are already included in subtotals above, this totals your overheads only.
- Choose Debit from the Debit/Credit drop-down list.
- Choose Left from the Left/Right drop-down list. This prints the total to the left of the column to distinguish it from the value of the individual rows.
Calculate the net profit
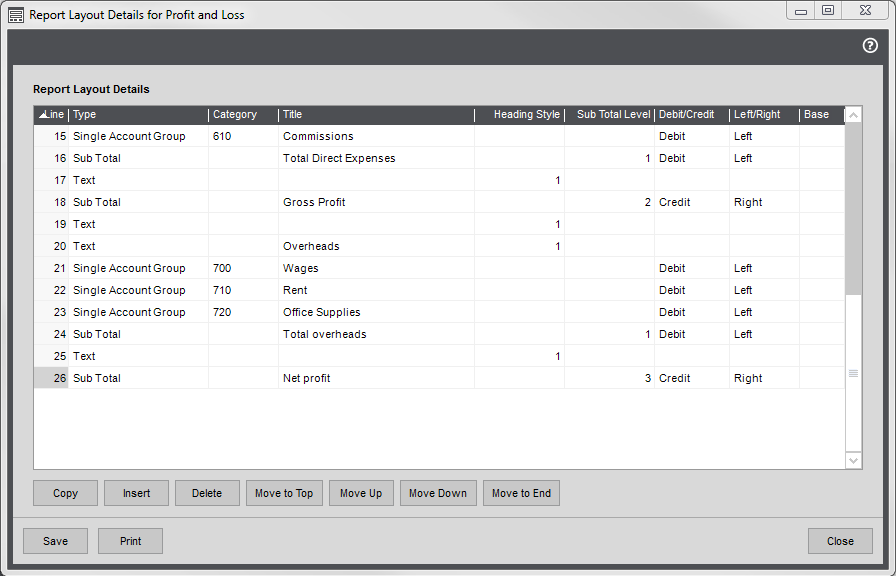
- Choose Subtotal from the Type drop-down list.
- Enter some text in the Title column, such as Net Profit before tax.
-
Choose 3 in the subtotal level, as this adds up all rows above not included in a level 3 subtotal.
This totals your sales, purchase, direct expenses and overheads, effectively totalling the overheads and the gross profit. As the gross profit is a credit value and overheads a debit value, this effectively subtracts the overheads from the gross profit.
- Choose Credit from the Debit/Credit drop-down list.
-
Choose Right from the Left/Right drop-down list. This prints the total to the right of the column to show it's a credit.
If this company wasn't making a profit, this value would be displayed in brackets.
- Enter a blank line.
If you want to show the net profit before and after tax
- Add another section which includes report categories for your tax.
- Total up the tax, using a level 1 subtotal. This should be a Debit.
- Create subtotal for net profit after tax. This should be a level 4 subtotal as this adds up all the rows above, adding the tax to the net profit. As the net profit is a credit value and tax a debit value, the tax is effectively subtracted from the net profit.
Check your results
Once you've finished, save the layout and check your results. We recommend that your check the following:
-
That your all Report Categories have been added and only once. Select the layout and click Validate.
This lists all the report categories that have been used more than once, or not at all.
-
Check the report format is correct - i.e. that all your lines, spaces and values are in the right place. To do this, select the layout and click Preview.
This shows how the layout appears when run as a report. It doesn't display any values.
-
Check the net profit on the Profit and Loss agrees with the net profit on your Balance Sheet.
Print the Profit and Loss report and the Balance Sheet for the same period. The profit on the P &L should be the same as the Profit on the Balance Sheet, as long as Balance Sheet is correct.
If it doesn't agree:
- Check that all relevant report categories and nominal accounts are included on the Profit and Layout.
- Check that all rows are included in a subtotal.
- Check that all subtotals are the correct level.
Print your Profit and Loss
Open: Nominal > Nominal Reports > Financial Statements.
-
Choose the Profit and Loss report you want to print.
Available Profit and Loss reportsAll reports include figure for the current and previous financial year.
Report Description Profit and Loss Detailed Shows the year to date up to the period selected.
Profit and Loss (MTD-YTD) Shows the period selected and the year to date. Profit and Loss (MTD-YTD Budgets) Shows the budget and actual figures for the period selected and the year to date.
You enter budgets on individual nominal accounts.
Profit and Loss (MTD - YTD Percentages) Shows the period selected and the year to date. Includes a percentage column to show the values as a percentage of the subtotal selected to be base value on the layout. Profit and Loss (MTD-YTD) by Cost Centre Shows a total for each cost centre for the period and selected and year to date. Profit and Loss (MTD-YTD Budgets) by Cost Centre Shows a total for each cost centre for budget and actual figures for the period selected and the year to date. Profit and Loss (MTD - YTD Percentages) by Cost Centre Shows a total for each cost centre for budget and actual figures for the period selected and the year to date. Includes a percentage column to show the values as a percentage of the subtotal selected to be base value on the layout. Profit and Loss Prior Year Shows the period selected and the year to date for the previous year. -
Choose the required layout from the Report Name report criteria. If you've created additional layouts, choose the one you want to use here. This will default to the first layout in the list (sorted alphabetically).
Tip: If you want to make sure a certain layout is always used, change the layout name to make sure it's the first one listed.